
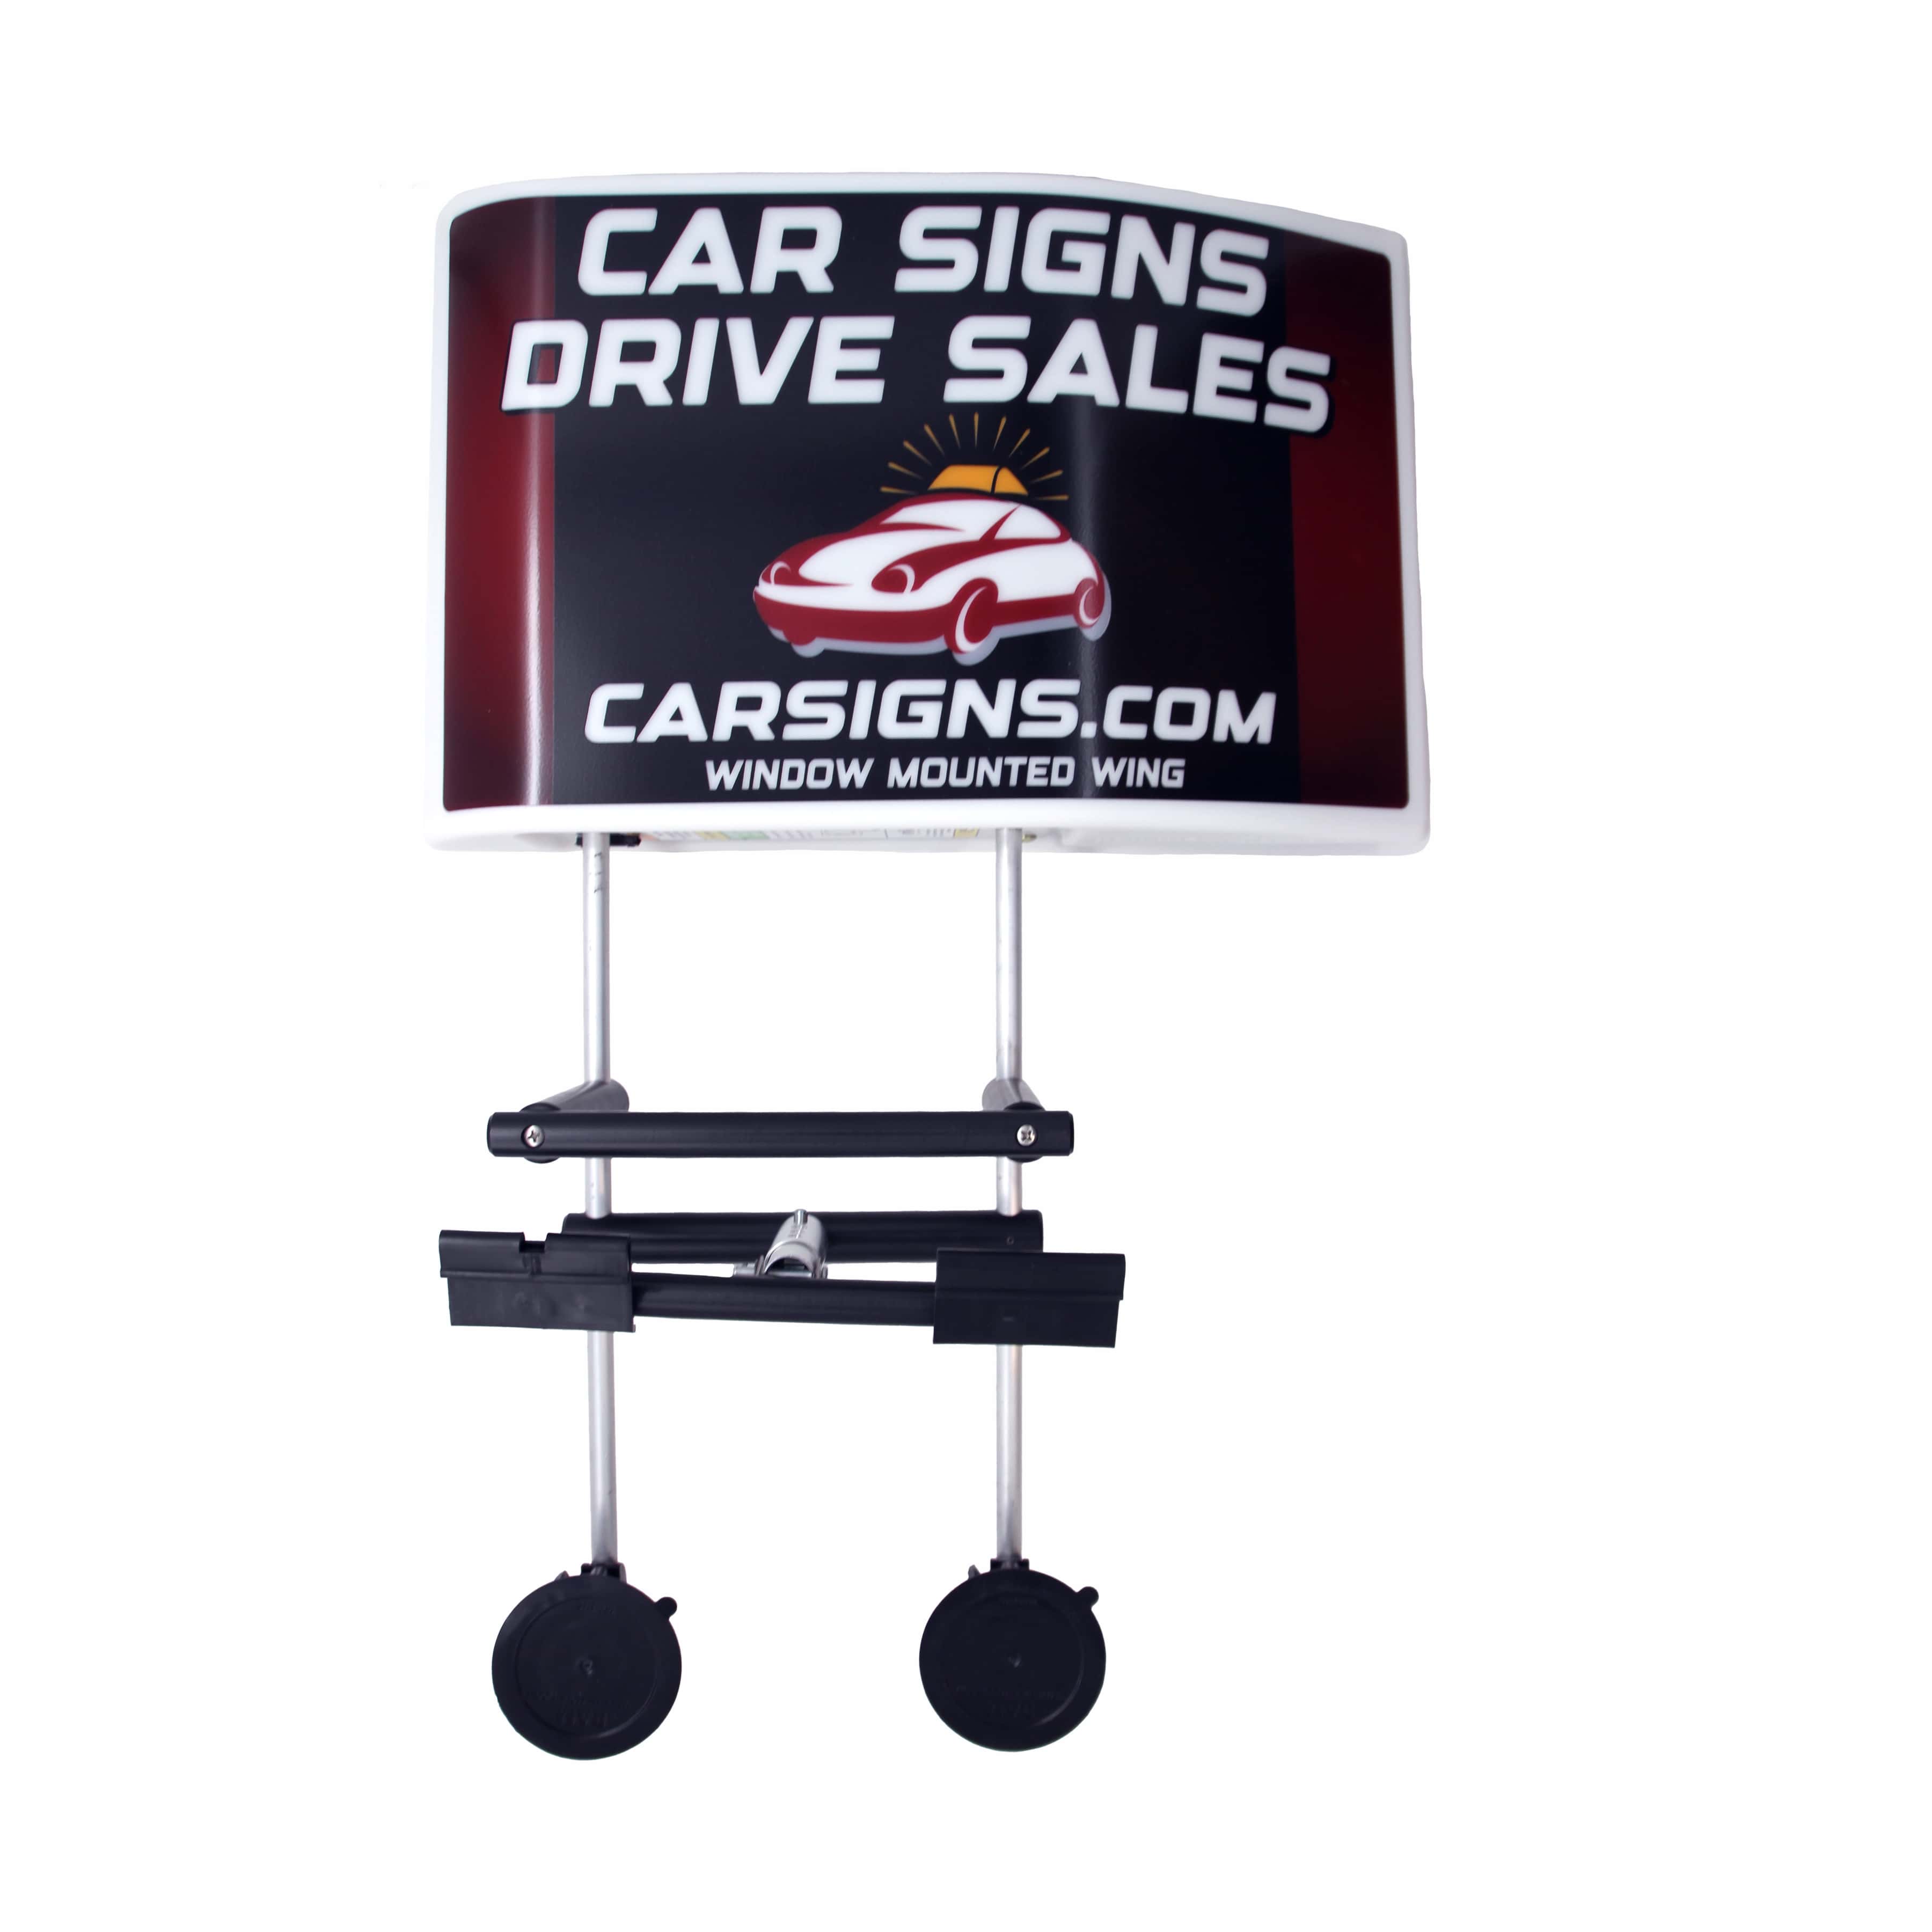
Does Speed Reduce Car Sign Visibility?
Speed and Car Sign Visibility
Vehicle speed shortens the time a driver or passerby has to notice, decode, and remember a car-mounted sign, which directly reduces car sign visibility and advertising effectiveness. This article explains the visual and cognitive mechanisms—reduced exposure time, smaller angular size, and limited processing bandwidth—that combine to make moving messages harder to read. You will learn measurable rules of thumb such as the 10-by-1 readability guideline, design principles that improve legibility at speed, how different mobile ad types compare, practical measurement methods for impressions and ROI, and advanced materials or technologies that mitigate speed-related loss. The guide emphasizes actionable recommendations for fonts, color contrast, message length, placement, and tracking tactics that account for highway and urban speed regimes. Throughout, related concepts like driver visual acuity, reaction time, impression modeling, and cost-per-impression are integrated so you can translate design choices into measurable advertising outcomes. Lastly, the piece suggests when to consult a vehicle-wrap specialist or signage expert for implementation and testing.
How Does Vehicle Speed Affect Car Sign Readability and Driver Perception?
Vehicle speed determines how long a sign remains within a driver’s useful field of view, and that exposure time is the primary mechanism by which speed reduces readability and comprehension. Faster speeds compress the window for visual recognition, shrinking the effective reading distance and lowering the chance a viewer encodes the message into memory. Recent studies and traffic-safety analyses show perception-response intervals and angular size reductions combine to create steep drops in legibility as speeds move from city to highway levels. Understanding these factors lets designers translate speed into concrete layout rules and readable distances for fonts and message length. The next subsections quantify visual acuity and then apply those numbers to legibility and message design for moving audiences.
What Is the Impact of Speed on Driver Visual Acuity and Reaction Time?
Driver visual acuity and reaction time set the baseline for how much information a moving sign can convey; acuity depends on retinal image size while reaction time depends on cognitive workload and attention. At higher speeds, the same sign subtends a smaller visual angle, effectively reducing readable detail; that means letters that are legible at 30 mph become unreadable at 65 mph unless scaled accordingly. Perception-response time remains roughly 1.5–2.5 seconds for basic recognition tasks under normal conditions, so exposure seconds at 30 mph (roughly 4–6 seconds within a side glance zone) contrast sharply with 65 mph (about 1.5–2 seconds), limiting comprehension. Translating these metrics into design means increasing letter height and contrast as speed rises and simplifying messages to single-focus claims to fit within available cognitive processing time. This numeric understanding prepares designers to apply the 10-by-1 rule and other conversion tools in the following subsection.
Early research into driver perception highlights the critical role of visual processing and attention in recognizing signs, especially when movement perception is challenged.
Driver Perception & Sign Visibility at Speed
600 drivers they found that a test of movement perception, signs and signals to overcome the driver's 'perceptual inertia'.
Vision, visibility, and perception in driving, 1980
How Does Speed Influence the Legibility and Readability of Car Signs?
Legibility (identifying characters) and readability (understanding grouped words) both degrade with speed due to decreased angular size and reduced processing time, which forces messages toward simpler structures. The 10-by-1 rule—ten feet of readable distance per inch of letter height—remains a practical starting point, but at highway speeds designers must err on the side of larger letters and fewer words; for example, a 2-inch letter is readable at roughly 20 feet, which is not enough for 65+ mph contexts where drivers have only a couple seconds to register content. Failure modes include condensed fonts, low contrast, and multi-line copy, all of which increase decoding time and reduce recall. To preserve impact, prioritize single-line brand names or a two-word claim and allow sufficient clear space around text so that drivers can resolve shapes quickly, especially when observation angles are oblique. These design imperatives lead into specific font, size, and contrast recommendations in the next section.
What Design Principles Optimize Vehicle Graphics for High-Speed Visibility?
Design principles for high-speed visibility convert perceptual constraints into concrete choices—big, simple letterforms, high contrast, minimal words, and strategic placement. These choices increase angular size, reduce decoding time, and improve brand fixation during brief exposures, yielding higher effective impressions despite shorter viewing windows. Good design treats the vehicle as a moving billboard and optimizes for the most common viewing angles and distances in the campaign’s operating environment. Below are the top design principles that consistently improve legibility at speed, followed by a short practical discussion that connects these rules to production choices.
The top five design principles for high-speed mobile advertising:
- Use large, wide sans-serif fonts so glyph shapes resolve quickly at distance.
- Limit copy to 1–3 words plus a bold logo to reduce cognitive load during split-second views.
- Maximize color contrast (light on dark or dark on light) and avoid busy photographic backgrounds.
- Scale letter height according to target speed using the 10-by-1 rule as a starting point.
- Place key messages on rear and side panels that align with typical sightlines for passing traffic.
These principles guide practical choices like choosing vinyl finishes and avoiding ornamentation, and they set clear production specs that a designer or signage specialist can implement. The following subsections unpack font/contrast specifics and placement/message simplicity in operational terms.
Which Font Types, Sizes, and Color Contrasts Enhance Legibility at Speed?
Selecting font family, letter height, and contrast directly changes readable distance; wide, open sans-serif families with high x-height outperform condensed or decorative scripts for fast legibility. For speed translation, apply the 10-by-1 rule conservatively: at 30 mph aim for letters that give 60–80 feet of readable distance (6–8 inch letters), while at 65+ mph target 12–15 inch letters for primary brand text. High luminance contrast pairs—black on yellow, white on dark blue, or black on white—are proven to increase recognition under varied lighting; adding a narrow outline or halo can preserve contrast when images or complex backgrounds are unavoidable. Choose color combinations mindful of color blindness accessibility so critical information does not rely on color alone. These typographic and color choices improve immediate legibility and prepare the layout for practical placement decisions, which we cover next.
How Does Strategic Placement and Message Simplicity Improve Mobile Billboard Effectiveness?
Placement and message hierarchy determine which elements a moving viewer actually sees and remembers; prioritize single-focus messages in locations aligned with driver sightlines such as rear centers, side doors, and roof-top panels for fleet visibility. A simple hierarchy—logo, single benefit word, optional short contact cue—minimizes scanning and promotes fast brand encoding. Side placements work best in urban slow-traffic settings where lateral viewing time is longer, while rear-centered large copy performs better for highway follow-and-pass impressions. Practical trade-offs include balancing rear visibility (high-speed exposure) with side impressions (volume in city routes) and ensuring that critical text is never placed in vehicle curvature or recessed panels that distort letterforms. These placement rules feed directly into product and material selection, which affects performance at different speeds and conditions.
How Do Different Mobile Advertising Types Perform in Terms of Visibility at High Speeds?
Different mobile advertising types—vehicle wraps, magnetic signs, and digital vehicle displays—have distinct visibility profiles, speed tolerances, and operational trade-offs that influence campaign fit. Wraps offer large continuous canvas area and consistent high-contrast application, magnets allow flexible temporary messaging but can suffer adhesion or visibility issues at high speeds, while digital displays add motion and brightness but introduce power, cost, and regulatory constraints. Comparing these options across visibility at speed, durability, installation complexity, and cost-per-impression helps advertisers choose the right format for highway-heavy or city-centric campaigns. The table below summarizes comparative characteristics to support practical selection.
| Ad Type | Speed Visibility | Durability | Installation Complexity |
|---|---|---|---|
| Vehicle Wrap | High across speeds when designed for contrast | Long-term (years) | High (professional install) |
| Magnetic Sign | Moderate; visibility drops with small size and at high speeds | Medium; adhesion variable | Low (DIY install) |
| Digital Display | Variable; high when bright and large | Medium; electronic maintenance | High (power + mounting) |
This comparison highlights that wraps typically deliver the most reliable high-speed visibility while magnets are best for short-term, low-speed use; digital displays can outperform static graphics in attention capture but require specific investment and compliance checks. The following subsections compare wrap vs magnet specifics and then evaluate digital displays in more detail.
What Are the Speed Tolerances and Visibility Factors of Vehicle Wraps Versus Magnetic Signs?
Vehicle wraps, when designed with large typography and high contrast, maintain high visibility at 65+ mph because they are integrated and uninterrupted across panels. Magnetic signs can be effective at city speeds but their adhesion and aerodynamic profile can reduce legibility and safety at highway speeds unless thick, professionally rated magnets and secure edges are used. Typical best practices for magnets include using heavy-duty materials, edge sealing, and regular inspections for lift—otherwise wind forces and dirt can degrade contact and visual quality. For highway campaigns, wraps or permanent decals sized for large letter heights are preferred to ensure consistent CPI and reduce maintenance risk. These material choices also relate to cost and impression metrics, which we cover in measurement strategies next.
EAV table comparing wrap, magnet, and digital displays:
| Format | Visibility at 65+ mph | Typical CPI Impact | Installation Notes |
|---|---|---|---|
| Vehicle Wrap | High with adequate letter size | Lower CPI for highways | Professional install; durable |
| Magnetic Sign | Variable; often low at high speeds | Higher CPI due to reduced recognition | Requires regular checks; best for low speeds |
| Digital Display | High when bright and well-sized | Variable; can lower CPI if interactive | Needs power, mounting, and compliance checks |
This table demonstrates that while digital displays can deliver strong visibility, wraps generally provide the most predictable highway performance; magnets remain useful for flexible, low-speed contexts. Next we examine the practical role of dynamic displays and where they make sense.
Are Emerging Digital Vehicle Displays More Effective for High-Speed Advertising?
Digital vehicle displays introduce motion, high brightness, and the ability to change messages, which can increase attention capture in moving traffic, but effectiveness at high speeds depends on screen size, pixel resolution, brightness, and refresh characteristics. At 65+ mph, small displays or rapidly changing content can become a blur; therefore, dynamic content must use large, high-contrast elements and slower transitions to remain legible. Practical limitations include power supply, weatherproofing, added weight, and local regulations that restrict moving lights or animated ads due to driver distraction concerns. Digital solutions excel for targeted urban routes with frequent stops or low speeds, or for fleets where interactivity and quick creative updates justify the cost. Pilot testing with sightline and in-motion legibility studies is essential before fleet-wide rollouts.
How Can Advertisers Measure the Impact and ROI of Vehicle Advertising at Varying Speeds?
Measuring mobile advertising impact requires a mix of modeled impressions, direct response tracking, and brand studies that account for speed-driven quality differences in impressions. Standard approaches include GPS-based time-in-view impression modeling that converts exposure seconds into estimated views, observational counts for validation, and short brand-recall surveys to gauge message retention. Speed influences both the volume and quality of impressions: faster routes may increase raw impressions per hour but reduce comprehension rate, so CPI (cost per impression) should be adjusted by a comprehension multiplier rather than raw counts alone. Below are accessible measurement methods and practical steps to implement them, followed by a short calculation example.
The challenge of accurately measuring the effectiveness of mobile advertising, similar to online advertising, is a continuous area of research and development for the industry.
Vehicular Advertising Effectiveness & Tracking Systems
Outdoor advertising is an old industry and the only reliably growing advertising sector other than online advertising. However, for it to sustain this growth, media providers must supply a comparable means of tracking an advertisement’s effectiveness to online advertising. The problem is a continual and emerging area of research for large outdoor advertising corporations, and as a result of this, smaller companies looking to join the market miss out on providing clients with valuable metrics due to a lack of resources. In this paper, we discuss the processes undertaken to develop software to be used as a means of better understanding the potential effectiveness of a fleet of private car, taxi or bus advertisements.
A Big Data Analysis System for Use in Vehicular Outdoor Advertising, 2016
- GPS-based impression modeling that multiplies time-in-view by traffic counts for estimated impressions.
- Brand-recall surveys conducted on panels with geo-fenced exposure windows to measure unaided and aided recall.
- Direct-response tracking via unique URLs, vanity phone numbers, or QR codes to capture attributable responses.
- Observational studies and video sampling to validate modeled impressions and legibility under real conditions.
Each method has trade-offs: GPS models scale well but need calibration, surveys capture quality but are costlier, and direct-response tracking depends on call-to-action clarity. Specialized providers or a signage expert can implement GPS modeling and combined survey protocols to ensure statistically valid estimates while adjusting CPI for comprehension rates; this external support is often useful when scaling from pilot to fleet. An example CPI calculation follows in the next paragraph to show how speed modifies outcomes.
What Methods Track Impressions and Brand Recall for Mobile Billboards?
Tracking impressions and recall effectively combines modeling and empirical validation: GPS logs give time-in-view, automated traffic counts provide exposure population, and recall surveys or observational intercepts reveal comprehension and brand lift. A recommended setup uses GPS-derived exposure windows to generate initial impression estimates, then runs targeted short surveys within the identified geography to measure unaided and aided brand recall, adjusting the model by measured comprehension rates. Video sampling using dashcams or roadside cameras offers an additional validation layer for legibility under actual speeds and sightlines; this helps refine font sizing and message length choices. Implementing these techniques typically requires coordination with analytics vendors or a measurement-savvy signage partner to ensure data quality and defensible CPI calculations.
How Does Speed Influence Cost Per Impression and Advertising ROI?
Speed changes both the numerator and denominator of CPI: faster-moving vehicles can pass more eyeballs per hour (increasing raw impressions) but each impression often carries a lower comprehension likelihood, effectively reducing the value per impression. To account for this, calculate an adjusted CPI by multiplying raw impressions by a comprehension rate (derived from surveys or pilot tests) so CPI reflects valuable impressions rather than mere exposures. For example, if highway routes generate 10,000 raw impressions at $500 cost (raw CPI $0.05) but measured comprehension is 20%, the comprehension-adjusted CPI is $0.25 per meaningful impression. Strategic adjustments—such as heavier branding, fewer words, and targeted daytime deployment—can improve comprehension rates and thus ROI on faster routes. These measurement-aware tactics guide budget allocation between city and highway deployments.
What Advanced Technologies and Materials Enhance Car Sign Visibility Despite Speed?
Advanced materials and display technologies can mitigate speed-related visibility loss by increasing luminance, reflectivity, and dynamic contrast, particularly for nighttime or low-light conditions. Retroreflective vinyl returns light to its source, enhancing legibility under headlight illumination, while high-intensity LEDs add active illumination and color control for critical elements. Smart visibility technologies—adaptive brightness, motion-optimized fonts, and sensor-triggered displays—promise better attention capture but bring complexity and regulatory considerations. Choosing materials depends on use-case: retroreflective films perform best for night highway exposure, while LED accents help with recognition during dawn/dusk periods. The next subsections quantify retroreflective and LED benefits and assess whether dynamic systems can overcome the fundamental limits imposed by speed.
Intro to the following comparison table and discussion: this table summarizes common technologies, their visibility benefits, and practical trade-offs for mobile advertising.
| Retroreflective Film | Improved night legibility; increased readable distance under headlights | Additional cost; may alter appearance in daylight |
|---|---|---|
| LED-enhanced Accents | Active illumination and contrast control; attracts attention in low light | Power requirements; potential regulatory limits |
| Dynamic Displays | Motion and message rotation increase attention | High cost, maintenance, and potential driver distraction concerns |
This comparison indicates that retroreflective materials and selective LED use offer high visibility gains with manageable trade-offs, while full dynamic displays require careful pilot testing and compliance checks. The following H3s provide more detail on night performance and dynamic tech feasibility.
How Do Retroreflective and LED-Enhanced Materials Improve Nighttime Legibility?
Retroreflective films work by directing incident light—typically from vehicle headlights—back toward the source, increasing the luminance of printed text and improving angular return to the driver’s eye; this mechanism extends legibility distance compared with non-reflective vinyl. Empirical field testing shows retroreflective sheeting can increase readable distance substantially at night, especially for high-contrast color combinations, making it valuable for highway-facing rear panels. LED-enhanced accents introduce active luminance that complements retroreflectivity, enabling consistent visibility at a range of distances and under varied ambient conditions. Trade-offs include higher material costs and potential installation complexity, but for campaigns targeting night-time highway impressions these technologies often yield a measurable lift in recall and effective CPI.
Can Dynamic Displays and Smart Visibility Technologies Overcome Speed-Related Challenges?
Dynamic displays and smart visibility systems can amplify attention by introducing motion and adaptive brightness, but they cannot fully overcome the physical limits of exposure time and angular resolution at high speeds without careful engineering. Readability for moving audiences demands large, slowly transitioning elements with very high luminance; otherwise text becomes a blur rather than a readable message. Regulatory constraints and safety considerations are significant—some jurisdictions restrict animated or flashing vehicle lighting—so pilots and legal checks are mandatory. Recommended approach: pilot dynamic content on low-risk routes with robust KPIs (time-in-view, recall uplift, direct responses) to validate whether increased attention translates into better ROI before scaling. Successful pilots often combine active illumination with static large-format branding for the best compromise.
What Are Common Questions About Speed and Car Sign Visibility?
This section answers practical people-also-ask style questions concisely, providing quick actionable guidance and clarifying key safety and performance considerations. Short, authoritative responses help readers decide on design tweaks, format selection, and deployment strategies that account for speed-related visibility challenges. The answers below are designed to be snippet-ready and to direct readers toward the right next steps, such as pilot testing or consulting a signage specialist.
How Does Speed Affect the Readability of Road and Vehicle Signs?
Speed shortens exposure time and reduces angular size, meaning smaller details and long phrases are quickly lost at higher speeds; the practical tip is to increase letter height and reduce word count as average speed rises. Use the 10-by-1 rule as a baseline and scale up letter height for highway contexts while keeping messages to one strong idea. Testing in-situ under representative speeds confirms if your chosen sizing and contrast deliver the intended readable distance. For campaigns, combine these design changes with measurement plans so you quantify whether readability improvements translate into higher brand recall.
Do Magnetic Signs Remain Secure and Visible at Highway Speeds?
Magnetic signs can remain secure and visible at moderate speeds when using heavy-duty magnets, proper edge sealing, and frequent inspections, but they are generally less reliable than integrated wraps at sustained highway speeds. Adhesion can fail or edges can lift under wind shear and debris, reducing both safety and legibility, so magnets are best for low-speed or short-term use. If highway exposure is core to a campaign, choose full wrap solutions sized for large-letter readability rather than relying on magnets. For any magnetic installation, inspect before each highway run and prefer professional-grade materials to minimize risk.
For implementation help or to validate choices experimentally, consult a vehicle-wrap specialist or a signage expert who can recommend materials, font sizing, and measurement protocols tailored to your routes and speed profiles. These experts can run pilot tests, implement GPS-based impression models, and integrate recall studies to convert design changes into defensible ROI metrics.


0 Comments
Leave a Comment